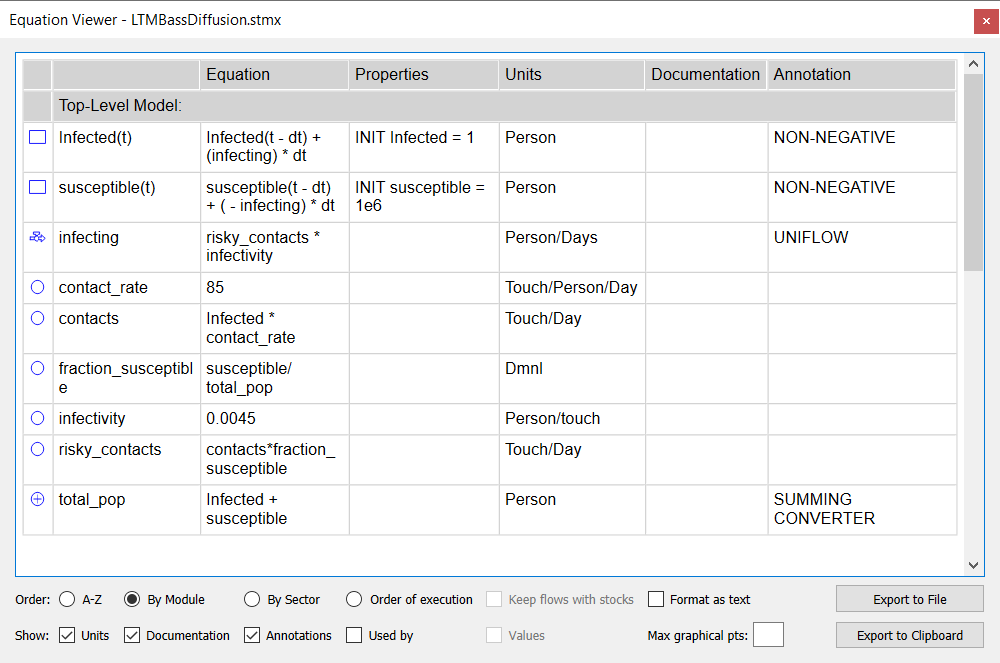
Use the Equation Viewer to see all your model equations organized according to options you select in the dialog.
To open the Equation Viewer, choose Equation Viewer from the Model menu.
Use these options to select the order in which you want the equations to be listed.
A-Z, if checked, will list everything alphabetically. Variables inside of modules will be listed with the module name as a prefix, to make them unambiguous. Everything in the root model will be listed first, followed by modules and their content in alphabetical order.
By Module, if checked, will list the contents of each module, starting from the root. The modules will be ordered alphabetically. Within each module, Stocks and their associated flows will be listed first, then Converters.
By Sector, if checked, will list the contents of each sector together. Variables not in a sector will be listed first.
Order of execution, if checked, will list variables in the order they're computed. The initialization order will be listed first, then the runtime order, so most variables will be listed twice. This option is only available when formatted as text.
Note: If you're using Delay Converters, the Runtime order specified when you choose order of execution may not be accurate; expressions such as SMTH1(a,b,c) are expanded to several intermediate computations, which may be interspersed with other model variables.
Keep Flows with Stocks, if checked, will list flows below the stocks that the are connected to. Flows that connect two stocks will be listed twice. If this is not checked flows will be listed based on the ordering selected. This option is only available when
Use this to switch between a tabular and text view of the content. The tabular view organizes everything into columns so that the name, equation, units and other information are all in a single row (one row per equation for non-apply-to-all variables). The text view will have multiple lines for a variable. There are some options, notably ordering by execution, that are only available when viewing as text.
Units, if checked, will show the units of measure in addition to the equations.
Documentation, if checked, will list any documentation written for the variables in addition to the equations.
Annotations, if checked, will include annotations on non-negative stocks, discrete stocks and uniflows. It will also place summary information about the model at the bottom of the window. In the tabular format annotations appear in a separate column. In the text format they are enclosed in {} (the comment delimiter for equations).
Used by, if checked, will list the variables that use the current variable. This can be helpful in building context around the purpose of a variable.
Values, if checked, will display the values of each of the variables when it is defined. This is available only if the variables are ordered by execution (thus only when formatted as text). If the model has not been run, the initial computed value will be reported. If the model has been run the final value will be reported. This is the same as the value seen when hovering over a variable on the model diagram.
Max graphical pts. specified the maximum number of points that will be shown for a graphical. By default all points are shown. Enter 0 to just display the number of points and not the points themselves.
Export to File allows you to save the content to a file. A file selection dialog will open when you click on this. In tabular view the file will be and html file laid out as the content is. In text format it will be a text file.
Export to Clipboard will put the equations listed into the clipboard so you can paste them into another application. In tabular format they will be placed on the clipboard in html format to allow easy pasting, though the icons for variable types will not be included.